Debugging
What is debugging?
Debugging is the process of identifying and fixing errors or defects in a computer program or software system. These errors, often referred to as "bugs," can cause the program to behave unexpectedly, crash, or produce incorrect results. Debugging is an essential part of software development and is carried out by developers to ensure that their programs work correctly and as intended.
Here are some key aspects of debugging:
-
Error Identification: The first step in debugging is to identify the error or bug. This can involve examining error messages, unexpected program behavior, or incorrect output.
-
Isolation: Once the error is identified, the next step is to isolate the portion of the code that is causing the problem. This can involve narrowing down the code that is responsible for the issue.
-
Reproduction: In many cases, it's important to be able to reproduce the error consistently. This helps in verifying that the bug has been fixed after making changes to the code.
-
Diagnosis: Debugging often requires understanding why the error is occurring. This might involve examining variables, data structures, and the program's control flow to determine the root cause of the problem.
-
Fixing the Bug: Once the bug is diagnosed, developers make changes to the code to fix the error. This can involve correcting syntax errors, logic errors, or other issues in the code.
-
Testing: After making changes, it's crucial to test the program to ensure that the bug has been successfully fixed. Testing can involve running the program with various inputs to verify that it behaves as expected.
-
Iterative Process: Debugging is often an iterative process, where developers may need to go through multiple cycles of identifying, isolating, diagnosing, and fixing bugs until the program works correctly.
There are various tools and techniques available to assist in debugging, including integrated development environments (IDEs) with debugging features, print statements or logging for tracing program execution, and specialized debugging tools. Debugging is a critical skill for software developers and is essential for producing reliable and error-free software.
Dersom debugging er nytt for deg, anbefaler vi at du starter med denne opplæringen på JetBrains sine sider.
Her får du også en innføring i bruk av IntelliJ sin debugger:
Tutorial: Debugging Your First Java Application
Oppsett for debugging
What is a debugger?
A debugger is a software tool or program that helps developers identify and resolve errors, bugs, and issues in computer programs. Debuggers provide a controlled environment for examining the execution of a program, allowing developers to inspect variables, data structures, and the program's control flow. They are an essential part of the software development process and help developers find and fix problems in their code efficiently. Here are some key features and functions of debuggers:
-
Breakpoints: Debuggers allow developers to set breakpoints at specific lines of code where they want the program to pause its execution. This allows them to inspect the program's state at that point in time.
-
Stepping Through Code: Developers can step through their code one line at a time, examining variable values and how the program flows through different functions or methods.
-
Variable Inspection: Debuggers enable developers to inspect the values of variables and data structures at any point during program execution. This helps in identifying incorrect or unexpected values.
-
Call Stack: Debuggers provide information about the call stack, showing which functions or methods were called and in what order. This can be crucial for understanding the flow of execution.
-
Watch Expressions: Developers can set up watch expressions to monitor specific variables or conditions. The debugger will alert them when the expression's value changes.
-
Conditional Breakpoints: Debuggers allow developers to set breakpoints that trigger only when a specified condition is met. This is useful for stopping execution when a particular situation arises.
-
Memory Inspection: In low-level programming languages, some debuggers allow for inspecting the contents of memory locations, which can be helpful for diagnosing memory-related issues.
-
Interactive Console: Some debuggers include an interactive console where developers can execute code and commands during debugging sessions. This can be useful for making on-the-fly changes or running diagnostic checks.
-
Trace and Profiling: Some debuggers offer trace and profiling capabilities, helping developers analyze the performance of their code and identify bottlenecks.
Debuggers come in various forms, from integrated development environment (IDE) debuggers that are tightly integrated with the development environment to standalone command-line debuggers. Popular programming languages and development environments often have their own debugger tools or support for third-party debuggers.
Debugging with a debugger can significantly speed up the process of finding and fixing bugs in software, making it an essential tool for developers during the software development and maintenance lifecycle.
IntelliJ IDEA provides a debugger for Java code. Depending on the installed/enabled plugins, you can also debug code written in other languages.
During a debugging session, you launch your program with the debugger attached to it. The purpose of the debugger is to interfere with the program execution and provide you with the information on what’s happening under the hood. This facilitates the process of detecting and fixing bugs in your program. (JetBrains - Debug code)
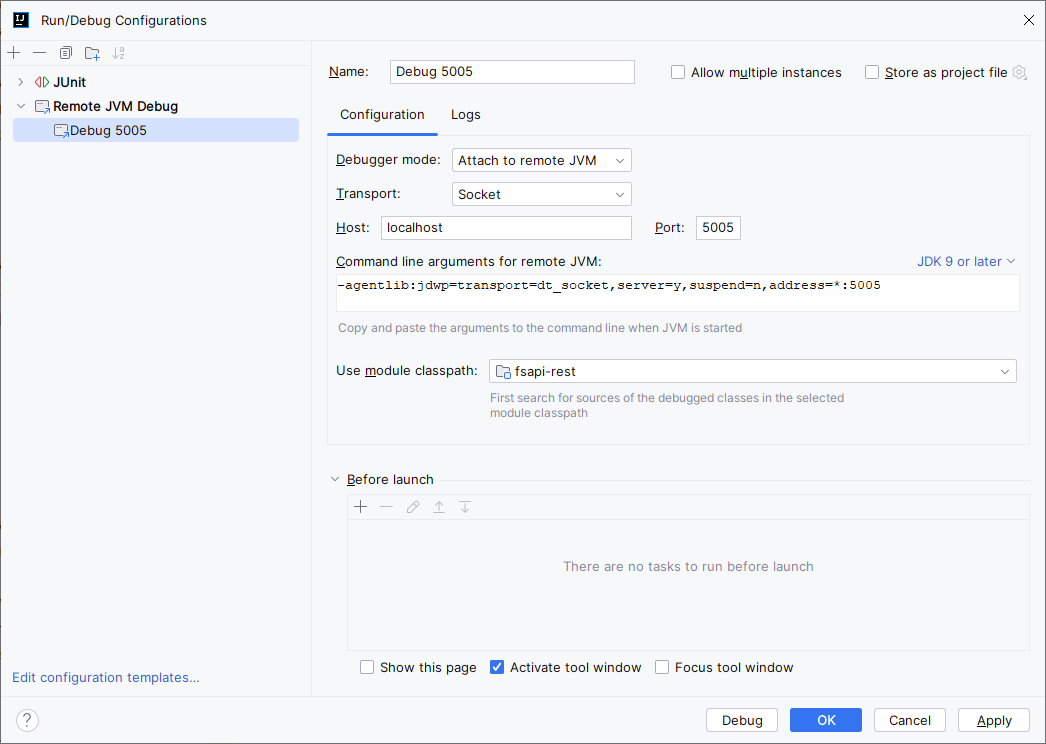
Opprett en 'Debugging Configuration' av type 'Remote JVM Debug'
- På Tittellinjen øverst i IntelliJ åpner du Run / Debugging Configuration og klikker på Edit Configurations...
- Dialogboksen Run/Debugging Configurations åpner seg
- Klikk på tegnet + (Add New Configuration) som åpner en meny Add New Configuration
- Velg menyvalg Remote JVM Debug
- Skriv inn eller velg følgende:
Name: Debug 5005
Debugger mode: Attach to remote JVM
Transport: Socket
Host: localhost
Port: 5005
Command line arguments for remote JVM:
   -agentlib:jdwp=transport=dt_socket,server=y,suspend=n,address=*:5005
Use module classpath: fsapi-rest
- Klikk OK
Starte en debuggingsesjon
- Start Wildfly på vanlig måte
- Når Wildfly kjører og meldingen
Deployed "ROOT.war" (runtime-name : "ROOT.war")dukker opp i loggen, - åpner du Run / Debugging Configuration på Tittellinjen
- og velger Debug 5005
- Klikk på 'Bug'-symbolet (Debug 'Debug 5005') til høyre
- Nå åpnes et debug-console med meldingen
Connected to the target VM, address: 'localhost:5005', transport: 'socket' - Sett et breakpoint i Javakoden og kjør applikasjonen
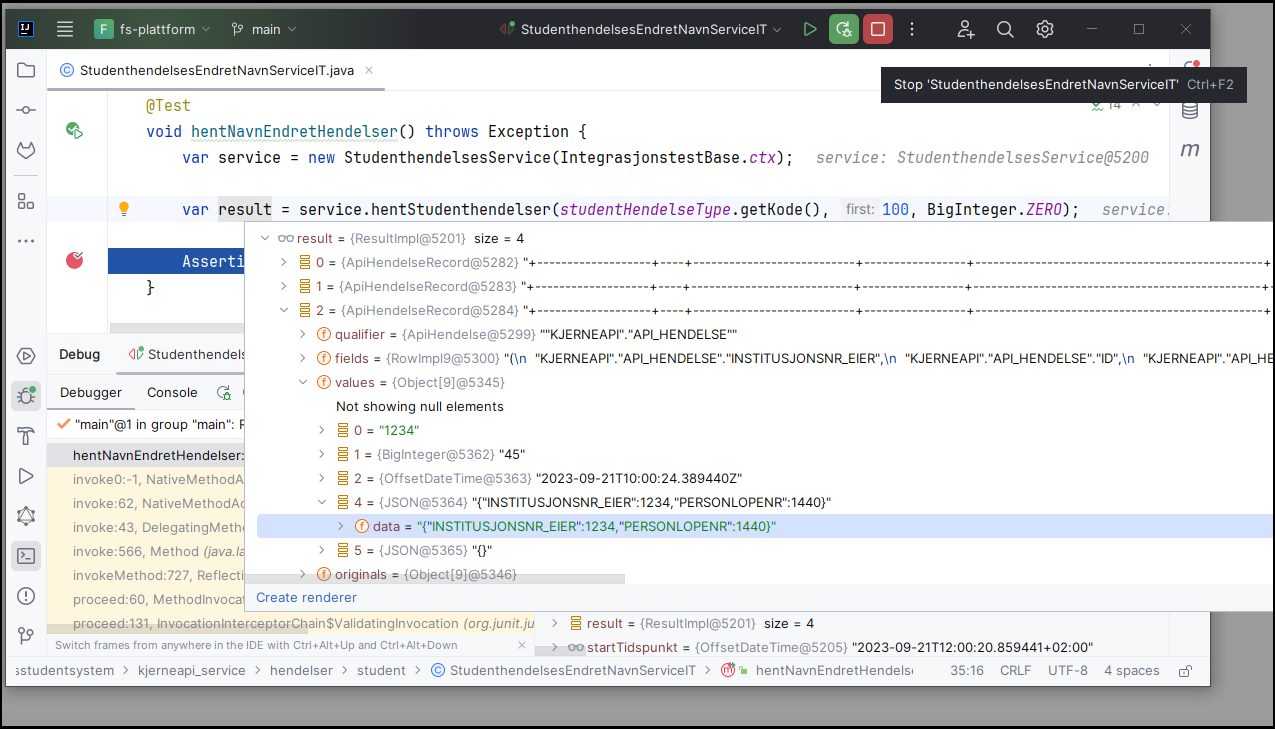
EKSEMPLER
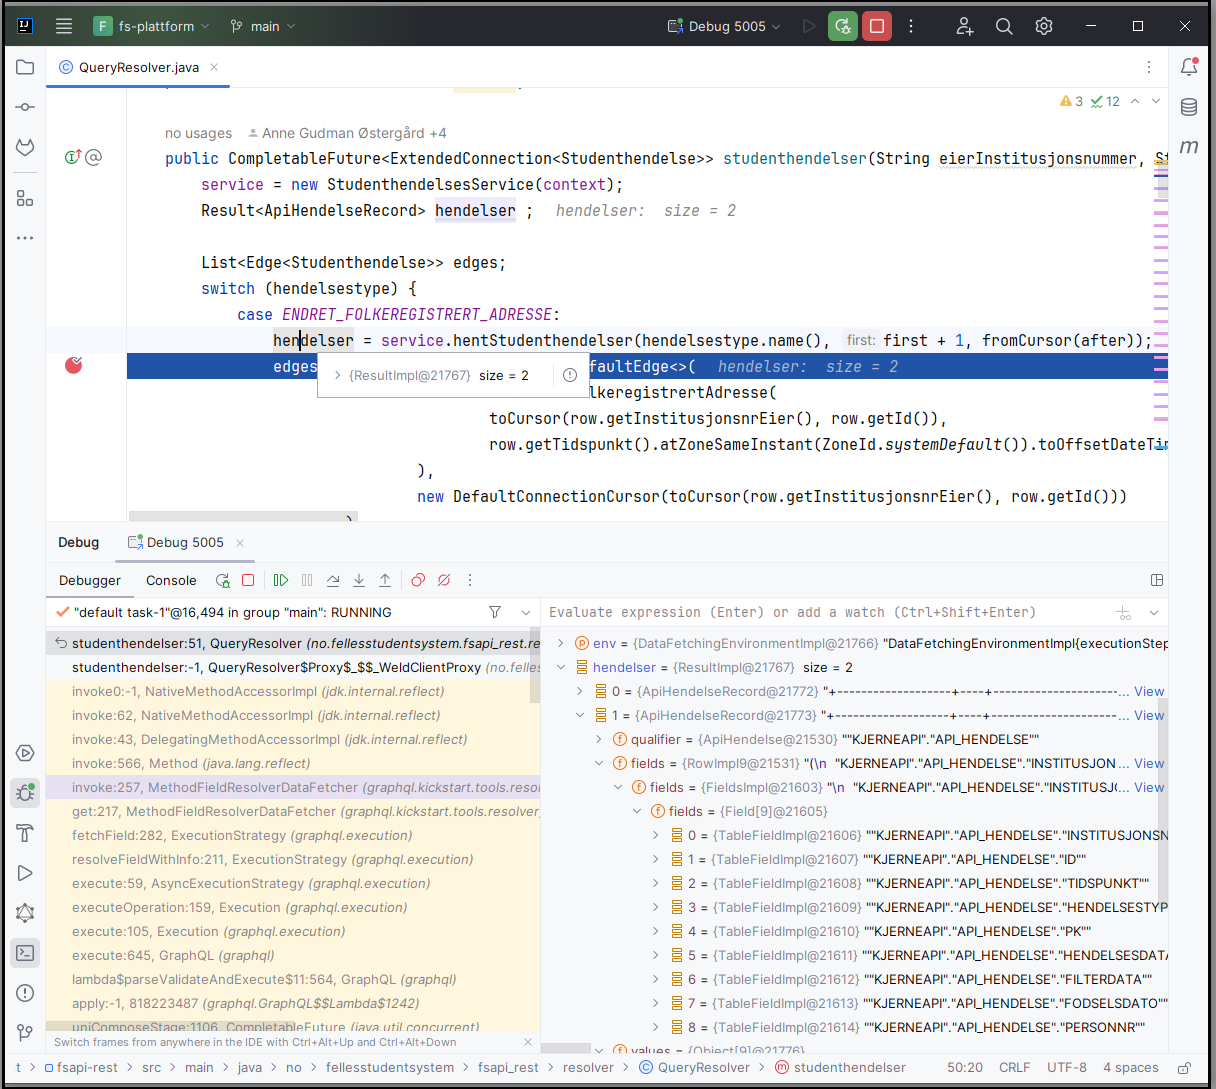
Debuggingssesjon hvor det kjøres en integrasjonstest
Debuggingssesjon hvor det kjøres et kall fra GraphiQL